The Article Series
In the series TV advertising for first time advertisers, we have covered the following topics till date:
- TV Advertising Facts & Figures: Useful facts and figures about television viewership and advertising in India, curated from reports by leading bodies like BARC, TAM, and EY.
- TV Campaign Measurement Terms Explained: How TV programs and campaign viewership are measured in India and some relevant terms that can help advertisers know more about TV viewership measurement.
- Data-driven Television Campaign Planning: The process of television advertising planning in brief and also explore how data obtained from authentic bodies like BARC can help us in making the right choice about television campaign planning.
- Competitor Analysis Report: How a competitor analysis report can help brands understand the advertising strategy followed by the top players in the category.
- How a post-evaluation report can help brands optimize their TV campaigns- A case study: An example of how the insights obtained from a post-evaluation report helped a popular board game app up its game in the regional markets.
- How can channel share report help brands understand their target audience’s viewership preference: How brands can use channel share report, time band report as well as program report to understand the viewership behavior of their target audience and accordingly, select the channels to run their ads on.
- TV Advertising: A quick guide to help you decide which regions and genres you should advertise in: Analysis of past advertising data from BARC to understand how brands in different sectors distribute their ads across languages and genres.
- TV Advertising FAQs: How long should my television as be?: We analyzed past advertising data from BARC to understand the Average Creative Duration across sectors and channel genres.
In this article, we will find out, on an average, how many television ad spots do brands run per day across product categories. This analysis would be done on data for 8 weeks starting from Aug 1 2020.
Introduction
One of the most common questions we are asked by the television advertisers is:
How many times should I run my television ad per day?
While we have tried to look for relevant information around it, there’s not much information about it especially for Television Advertising in India. Hence, we decided to come up with this article series. If you are a first time television advertiser, we would advise you to read our previous articles that would be helpful in understanding how data-driven television advertising campaign takes place. You would get detailed insights into how to make the best use of television advertising with the help of historic TV advertising reports published by BARC.
Coming back to the question, in this article, we have tried to find out the answers by analyzing television advertising data for 8 weeks starting from 1stAugust 2020. We also wanted to know if the average number of television ad spots per day vary across product categories. As we dive deeper, you would get to see the following advertising data number for brands under each category:
- Median Value: Median value refers to the middle value in a sorted list. This value remains unaffected by the presence of outliers hence works as a better indicator of a value range. This indicates how many ads/day most of the advertisers are playing. This indicates how many ads/day/channel most of the advertisers are playing.
- Mode Value: Mode is the value that appears most frequently in a data set. The mode value is important here because this value would signify the most usual value used by the advertisers.
But before we let ourselves become overwhelmed with data, let’s recap on some important concepts we learned in one of our previous articles on television advertisement to understand how we usually come up with number of ad spots to be played every day.
What do we know about Television Campaign Planning So Far?
Following is a flowchart that explains the entire television ad campaign planning

Brand Brief: All marketing activities start with the brand sharing a brief description of the brand/product, the core target group, the target market, the message that they would like to convey and the campaign objective.
Competitor’s Campaign Study: In a number of scenarios, especially in the case of advertising on TV for the first time, brands do not have a clear idea of details like reach and frequency, etc. The media agency, in this case, can do a competitor analysis to find details like Share of Expenditure (SOE), Share of Voice (SOV), Channel Mix, Scheduling, Time Band Mix, Program Mix, Reach & Frequency, and Campaign objective and creatives.
Media Brief: Based on the inputs provided by the brand and insights obtained from the competitor analysis, media team/media agency comes up with a media brief that covers media goals to be achieved through the campaign, campaign approach and the recommended budget.
Select Channels, Time Band and Program: Advertisers can determine historical reach and ratings of channels for their selected region and target group and select TV channels on this basis. Similar reports can be obtained to find out the best performing time-band and program for placing ads.
Determine Target Reach & Frequency: Reach and frequency have an inversely related which means for a fixed budget, you can either increase reach or frequency. While competitor analysis gives one a fair idea about this, tools like Reach-GRP graph and frequency calculator can help you determine this. You can check our article for details.
Create Plan & Check Efficiency: The next part is creating a plan based on the data obtained from BARC tool and check it’s efficiency by comparing with previous and other plans.
Execute Plan, Monitor & Evaluate Campaign after it’s over: While the campaign is going on and after it’s over mid-campaign evaluation and post-campaign evaluation report would help advertisers evaluate the efficiency of the plan and campaign execution.
The above process explains the process of determining the campaign period and GRP to be obtained. However, the question remains- how would one distribute the spots across the campaign period. In this article, we would determine how many spots usually brands across product categories place per day while in the next article, we will see average campaign duration and spot-wise distribution across weeks.
Analyzing Past Campaigns Data
As discussed earlier in the article, we have analyzed advertising data for 8 weeks starting 1st August 2020. This included 627 brands in total. We also wanted to check how many channels does a brand opt for TV advertising in general and the following is the distribution of brands on basis of number of channels advertised on.

As we can see in the chart above, majority of brands have opted for advertising on a single channel with another 45% of brands opting for less than 10 channels.
On doing an overall analysis, we found that the median value of no of ads/day/channel is 4 while the mode value is 1. In the following sections, we would analyze the data after segregating it on basis of product category, language and channel genres.
Does no of ads per day change across product categories?
In the following table, we will see if the number of TV ad spots per day per channel is similar across the product categories. While we have noted down various measures of central tendency for the data like median, mode and even minimum and maximum value, we would recommend you to consider the median value.
| Sector | Median Value | Mode Value |
| Agriculture | 4 | 1 |
| Automobile | 3 | 1 |
| BFSI | 3 | 1 |
| Building Material | 6 | 1 |
| Computer | 4 | 4 |
| Corporate Branding | 6 | 1 |
| Durables | 4 | 5 |
| Education | 5 | 1 |
| Food & Beverages | 3 | 1 |
| Hair Care | 3 | 3 |
| Household | 4 | 2 |
| Laundry | 3 | 1 |
| Media | 3 | 1 |
| Personal Accessories | 2 | 1 |
| Personal Care | 4 | 4 |
| Personal Healthcare | 4 | 1 |
| Retail | 3 | 1 |
| Services | 4 | 1 |
| Telecom Products | 6 | 8 |
| Telecom/Internet Service Providers | 8 | 4 |
| Textiles | 3 | 2 |
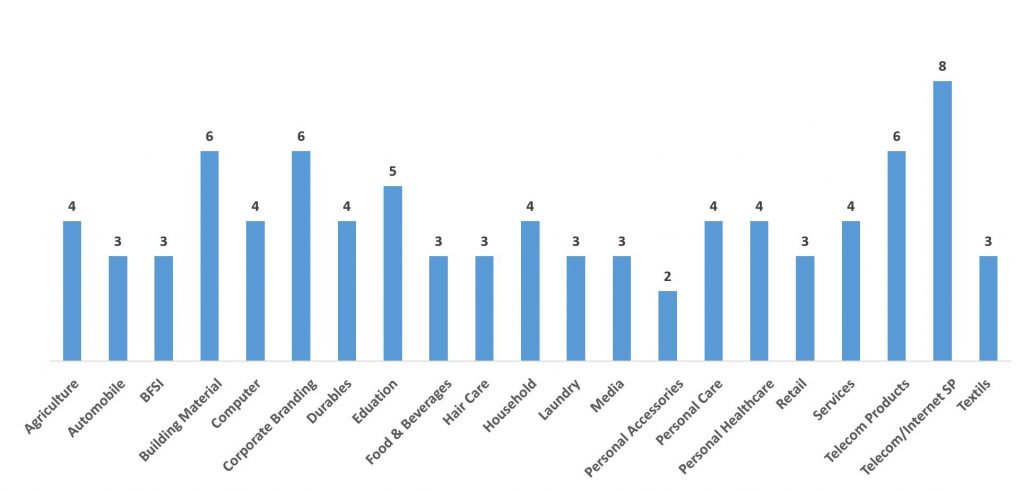
As we can see in the table above, the median value for average number of TV ad spots per day per channel is 3 or 4 for maximum product categories while the most common mode value is 1.
Does language affect the no of adspotsper day?
We also carried out an analysis based on channel language and channel genres and the following are the findings:
| Language | Median Value | Mode Value |
| Bengali | 4 | 1 |
| English | 4 | 1 |
| Hindi | 4 | 1 |
| Kannada | 4 | 1 |
| Malayalam | 3 | 1 |
| Marathi | 3 | 1 |
| Tamil | 4 | 1 |
| Telugu | 3 | 1 |
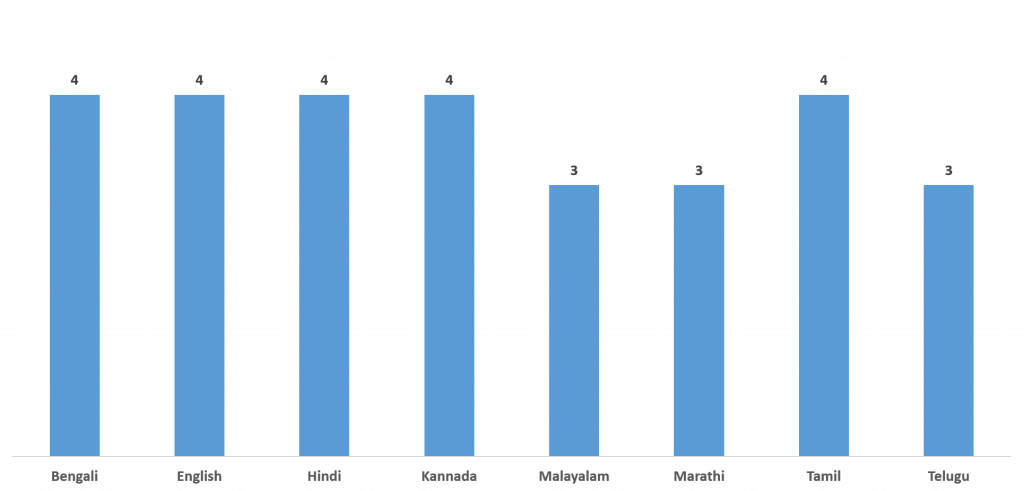
The median and mode value of avg ad spots per channel per day across languages was similar to those across product categories i.e. 3-4 and 1 respectively.
Do different genres exhibit different no of ads per day value?
| Genre | Median Value | Mode Value |
| Devotional | 3 | 1 |
| GEC | 2 | 1 |
| Infotainment | 6 | 1 |
| Kids | 3 | 1 |
| Movies | 4 | 1 |
| Music | 5 | 1 |
| News | 5 | 1 |
| Sports | 2 | 1 |
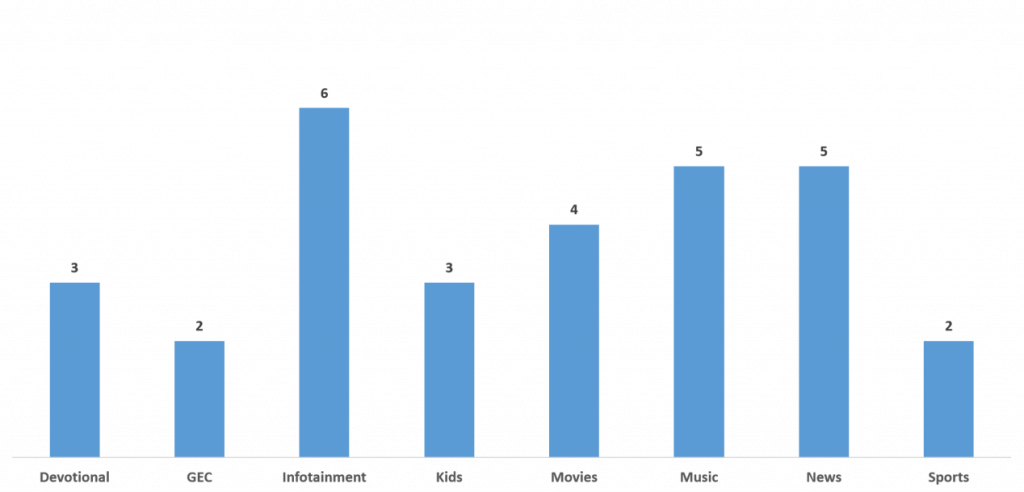
Unlike product categories and languages where we saw a uniform trend in terms of average spots per channel per day, the median value of average spots per channel per day across channel genres varies by a great extent- being low at 2 for GEC and Sports and very high at 5 and 6 for Music, News and Infotainment. Two factors that might be contributing to this are:
- Ad Rates: Genres like GECs and Sports (during live matches) have very high ad rates as compared to Music, News, and Infotainment channels.
- Audience Engagement: GEC and Sports channels offer very high viewership and audience engagement when compared to news, music, and infotainment channels. Hence, more ad spots need to be played on news, music, and infotainment channels to get a higher reach.
Summary
Summarizing the above findings in the following charts:
Through our analysis, we arrived at a conclusion that on an average brands run 4 ad spots per day per channel. Following is a graphical representation of the analysis across product categories, channel language and genres:
- The median value of the average no of spots per channel per day across product categories:

2. Median value of average no of spots per channel per day across languages:

3. Median value of average no of spots per channel per day across genres:

Check out this space for more information on television advertising. In case you have a query regarding television advertising, let us know in the comment section or send us a mail at Help@TheMediaAnt.com.


