In the first article of the series, we discussed some useful facts and figures about television viewership and advertising in India, curated from reports by leading bodies like BARC, TAM and EY:
- Key facts about television viewership in India
- Growth of television viewership in 2019 based on
- Channel genre
- State
- Language
- TV viewership trends across geography
- TV advertising in India: Jan 2020 to Jun 2020
In the second article of the series, we would discuss how TV programs and campaign viewership are measured in India and some relevant terms that can help advertisers know more about the TV viewership measurement.
The article would also help the readers understand the upcoming articles based on various reports that help television advertisers plan and evaluate TV advertising campaigns.
How is TV viewership in India measured?
Before talking about TV viewership measurement, let’s get to know more about BARC. BARC stands for Broadcast Audience Research Council. It was formed in 2010 in Mumbai by the following three industry bodies:
Indian Broadcasting Foundation (IBF), Indian Society of Advertisers (ISA) and Advertising Agencies Association of India (AAAI). Currently, BARC has a panel size of 1,80,000 individuals that makes BARC the largest measuring company of its kind in the world.
BARC India conducts a nationwide survey at regular intervals and determines a sample of households that represent all the TV households in India.
These sample households have special devices called Bar-o-meters installed. With the help of audio watermarking, BARC embeds TV content with audio watermarks that are inaudible to human ears but are captured by the Bar-O-meters. This helps BARC to get accurate data on TV viewership.
A Simple Example of TV Viewership Measurement
To understand BARC terms in true sense, we would need to understand a little bit about how they measure viewership. Following is a very basic example trying to replicate a real world scenario.
The first thing to understand here is whenever we talk about any type of measurement whether it’s in terms of reach, rating, channel share, etc., we need to know the target group (target audience).
This target audience can be defined in terms of the region (state/metros), age group, gender, status, etc. These data cuts are already pre-defined in BARC.
To simplify it further, here’s an example. I want to target people living in a building X through a half-an-hour long TV program LMNO and I want to know how many people in the building X watched the latest episode of series LMNO.
There are 800 households and 4000 people living in the building. This number is too large for me to track so through advanced statistics, I identify 8 individuals who represent all the 4000 people in the building.
Each of these people represents 500 people in the building which means their behavior can be extrapolated to the rest of the people in the building.

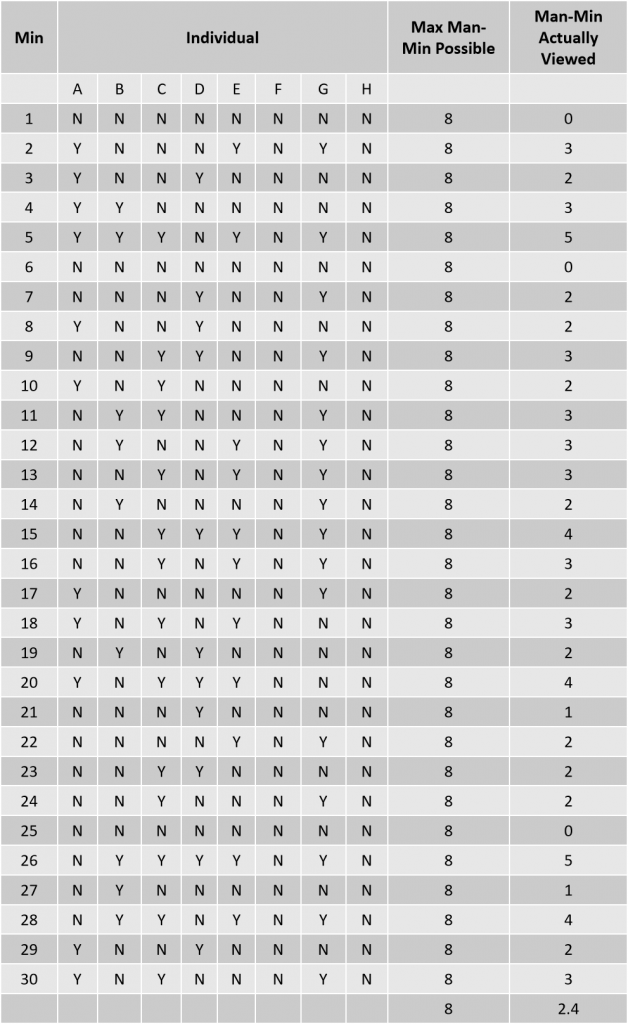
We want to see how these 8 people engaged with the content. Following is a table representing minute-by-minute viewership of the program. Y means the person watched the program for that particular minute. N means the person didn’t watch it.

From the table above, we can also check how many minutes A,B,C,D,E,F,G and H watched TV for

Now, remember each individual actually represents 500 people. We would now try to understand the various metrics based on this table.
- Reach: This can be defined as the number of people who have watched at least one minute of TV content. As seen from the table above, it is 6. Since one individual represents 500 people, the total reach of the latest episode of the TV program LMNO in the building X is 6*500= 3000
- Reach%: This is the reach (we discussed above) expressed as a percentage of total audience in the target group.
The total number of people in the target group which is the building X here is 4000 and the reach of the program is 3000 hence the reach % would 75%. - Impressions: This is the total man-minutes of viewing of content, averaged per minute across total duration. In the table above, we see the total number of man-minutes of content viewing is 72 while the total duration is 30 minutes. Hence, the total number of impressions would be 72/30*500= 1200
- Rating % or Television Rating (TVR): Rating percentage is the man-minutes of actual viewing expressed as a percentage of total man-minutes of viewership possible, averaged per minute across the total duration of the content. In the case of the example, it would be 72/(308)100= 30
- ATS (Viewer): This is the average time spent watching the content by the individuals who actually watched the content. In this example, it would be 72 minutes (sum of total minutes viewed by A, B, C, D, E, and G) divided by 6 which comes to 12 minutes.
- ATS (Universe): This is the average time spent watching the content spread across the entire target group. In this example, it would be 72 minutes averaged over 8 people which would be 9 minutes.
Please note that similar to TV programs, similar figures can be obtained for commercial ads too that are run on the television. Following are some more terms that would help you in future to understand
- Average OTS/Frequency: Average number of times a person reached by a content (exposed to a TV program/ad/promo at least once) is exposed to it.
- Gross Reach: It is the total number of impressions created during a campaign. In other words, it is the sum of the reach in 000s of individual programs or publications and is a duplicated figure.
- Gross Rating Point (GRP): It is the sum of ratings of individual programs, It is a duplicated figure. GRP is the gross reach expressed as a percentage of the total size of the group/universe. GRP= Reach in % * Avg OTS
Understanding the relationship between Reach & Frequency
Now that we understand reach, frequency and rating point, let’s see how the relationship between reach and frequency plays out in terms of advertising.
In terms of advertising, for the same advertising budget, reach and frequency exist in a relationship where one goes down when the other goes up.
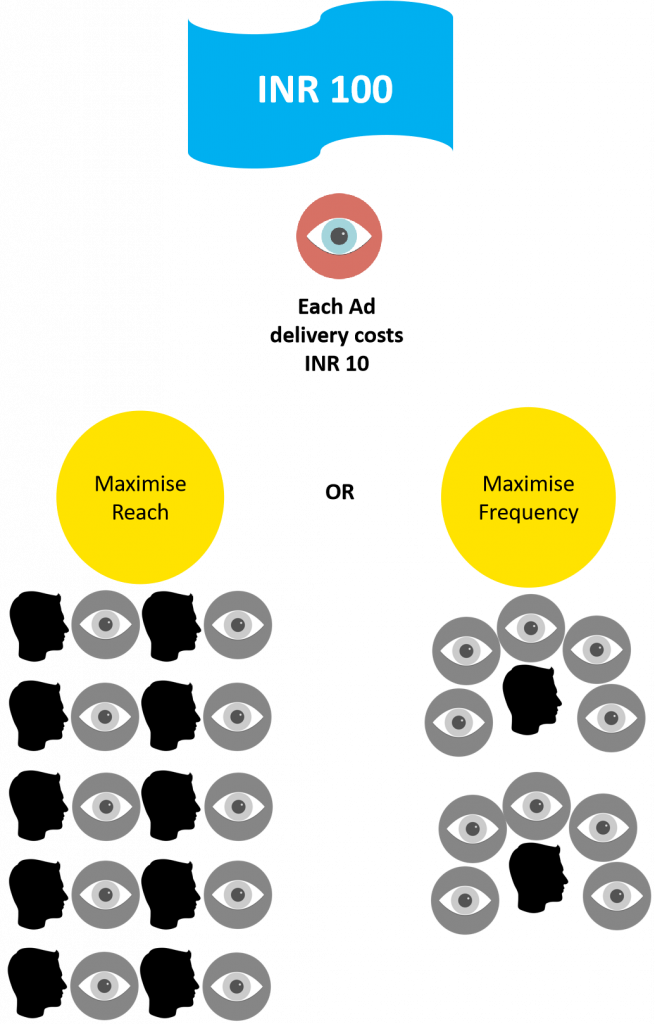
For example, if I have an advertising budget of INR 100 and every time I show my ad to someone, I need to pay INR 10. I have 20 people in my target group.
If I want to reach the maximum number of people, I can show the ad to 100/10= 10 people at a frequency of 1.
However, if I would like to have a deeper impact on my audience, I may choose to show the audience my ad 5 times. This would mean I would be able to reach 100/(5*10)= 2 people.

To understand reach and frequency, we usually represent them in terms of the frequency distribution.
For example,
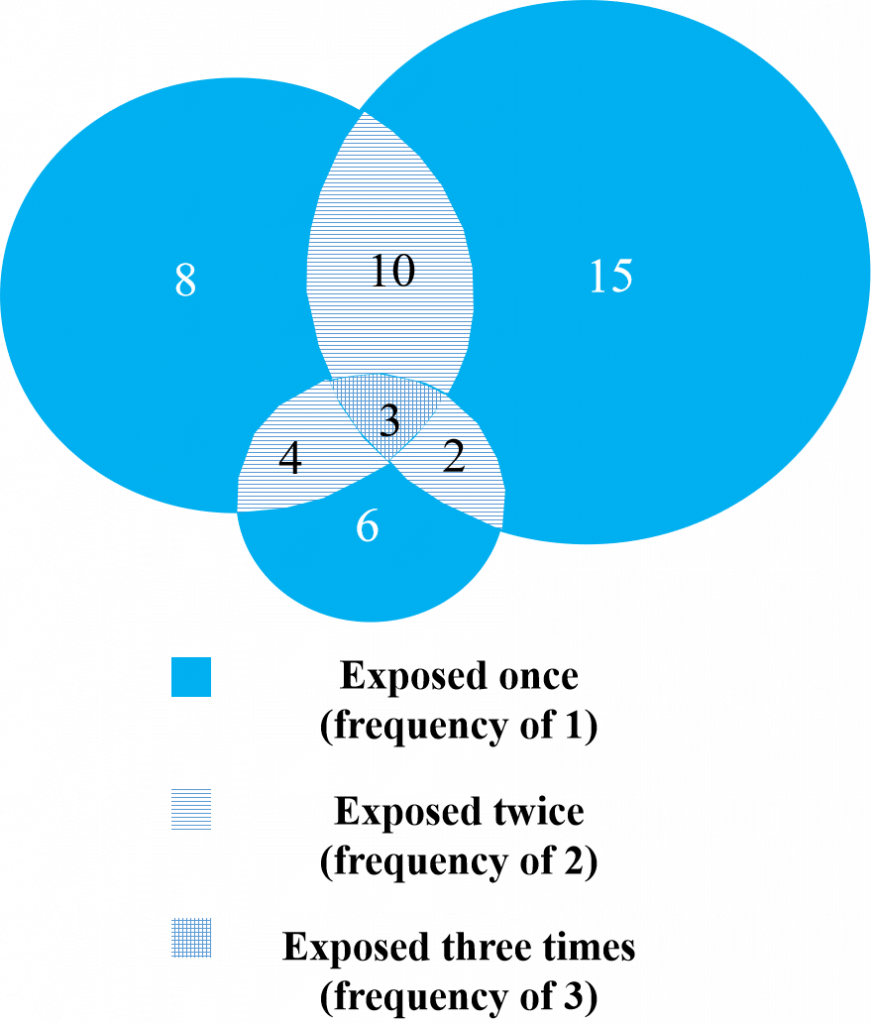
Consider a TV ad that ran on 3 spots and has an individual rating (Rating%) of 25, 15, and 30.

The GRP would be a sum of the four individual ratings: 15+25+30= 70
But the set of audience for each of the ads would not have been mutually exclusive. Hence, to represent it more realistically:

This simply means that
- 70% audience was exposed to at least 1 spot
- 19% audience was exposed to at least 2 spots
- 3% audience was exposed to 3 spots
To express it in a better format, here’s a frequency distribution graph

Some questions to test your understanding
- Based on the formula to calculate the GRP, can you calculate the GRP for the campaign?

- 8
- 21
- 13
- 42
- Based on the information below, can you answer the questions that follow?
Target Group Size: 1,00,000 people
GRP: 200
Reach: 25%
a. What is the average frequency?
- 2
- 4
- 6
- 8
b. How many impressions were delivered?
- 50,000
- 1,00,000
- 2,00,000
- 4,00,000
Would like to know more about TV advertising? Send us your queries at Help@TheMediaAnt.com. Looking for television advertising rates? Visit www.themediaant.com/television
Answers: 1: 42; 2(a): 8; 2(b): 2,00,000


